Stacked Imbalance
Published January 13, 2026
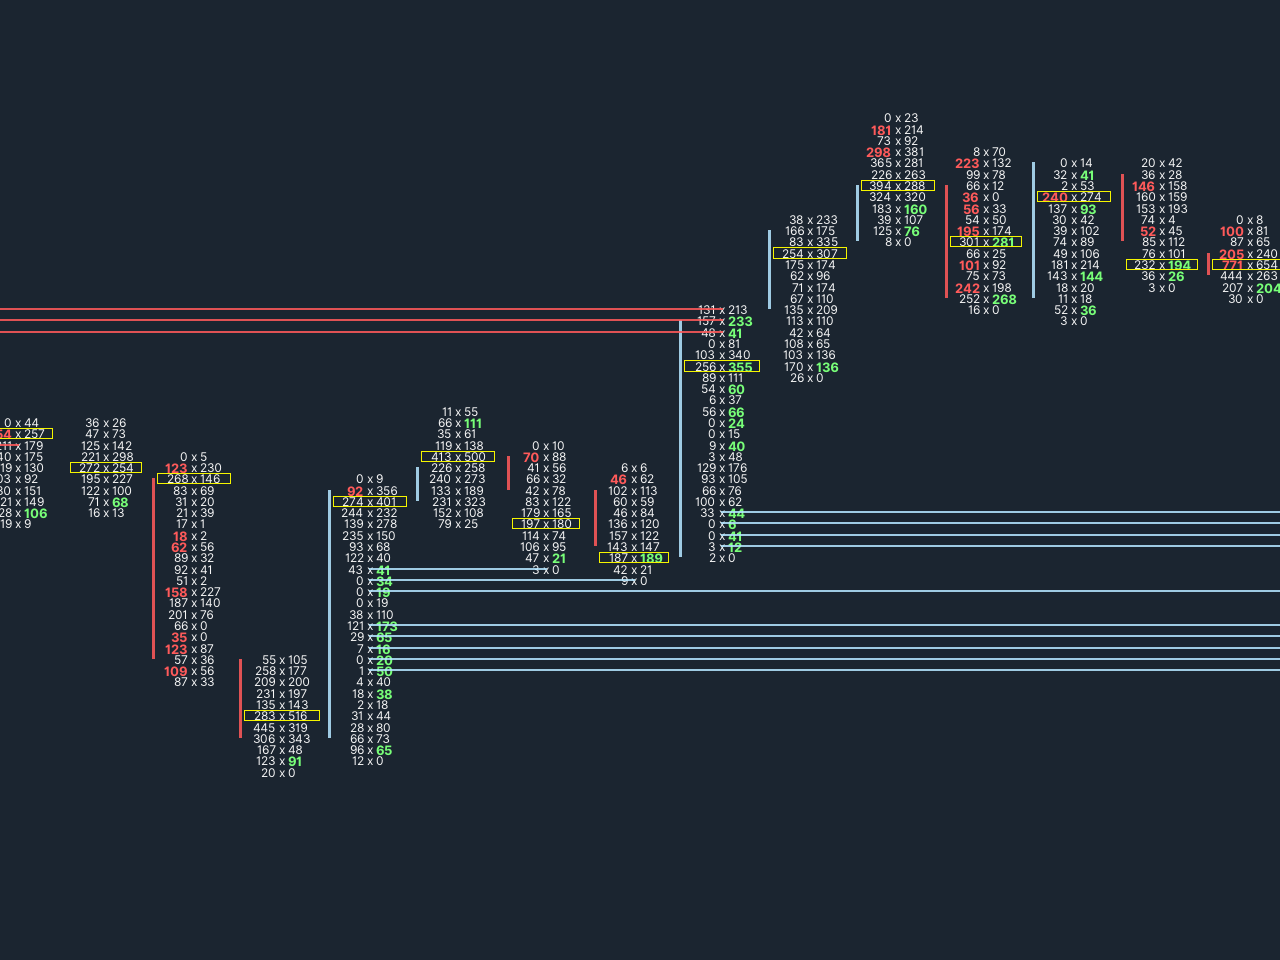
Detects consecutive order flow imbalances to identify potential support and resistance zones. When multiple adjacent price levels show the same directional imbalance (bid vs ask volume exceeding a threshold ratio), horizontal lines are drawn extending from that zone.
Stacked imbalances often indicate areas where aggressive buying or selling occurred, which may act as future reference points when price revisits. Bullish stacks (buying imbalances) are drawn in one color, bearish stacks in another.
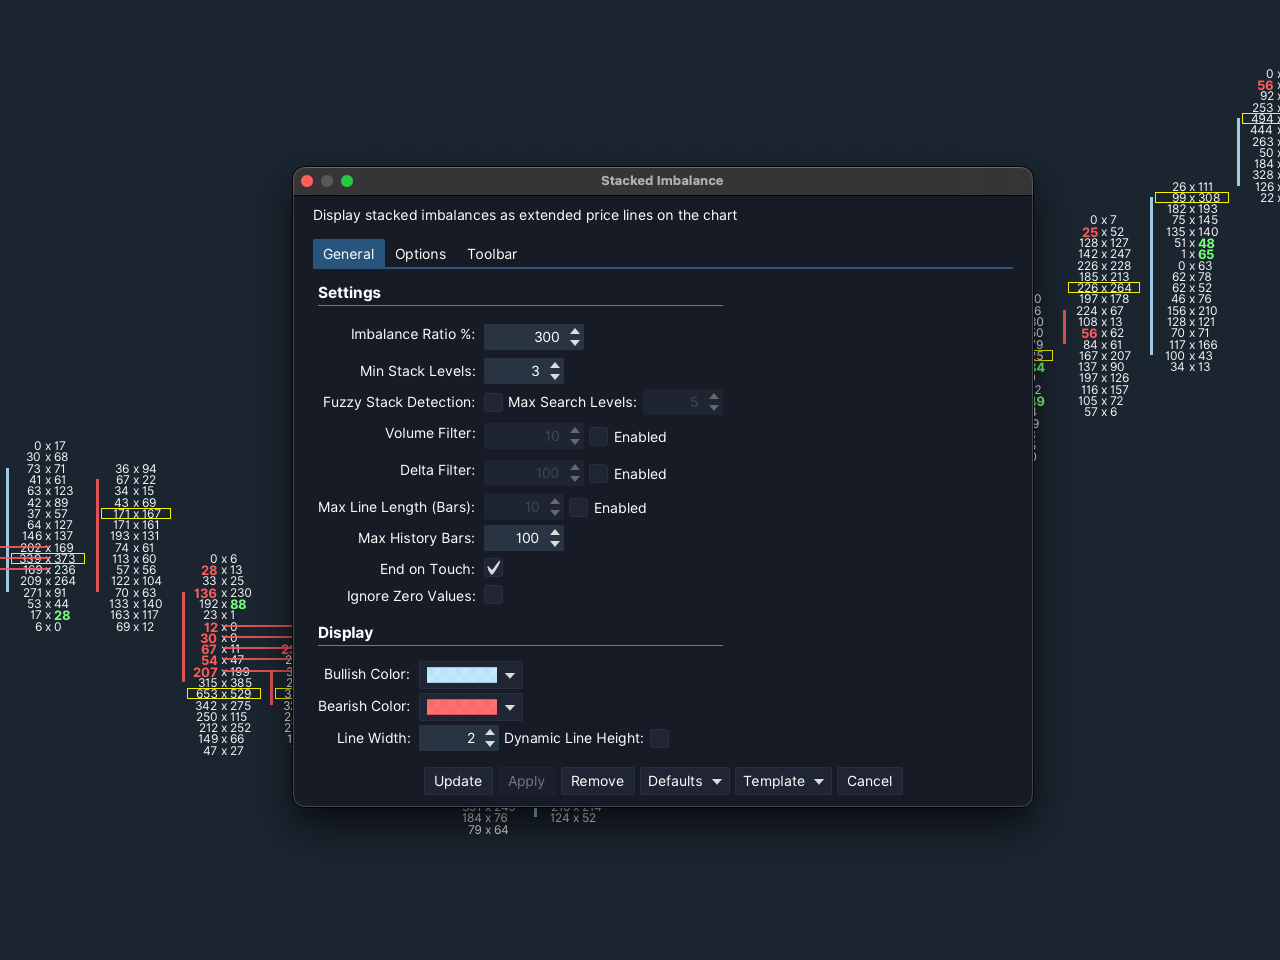
Settings include the imbalance ratio threshold, minimum stack size, volume/delta filters, and line termination options (end on touch or extend to maximum bar count). Fuzzy detection mode allows for small gaps in the stack.