Candle Statistics
Published December 16, 2025
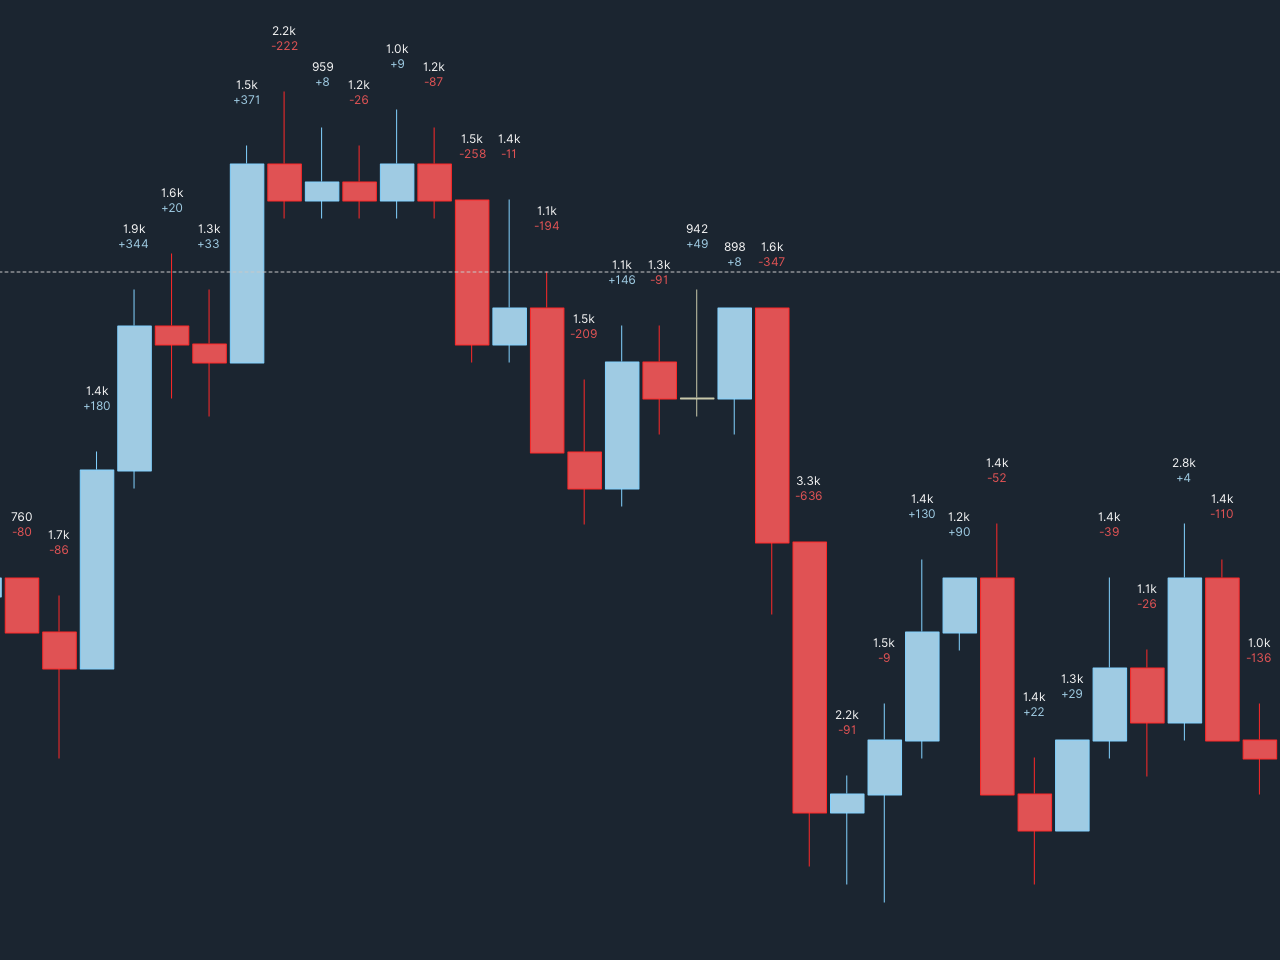
Displays delta and volume statistics as text overlays directly on price candles. The study calculates bid/ask delta from tick data and renders the values above or below each candle.
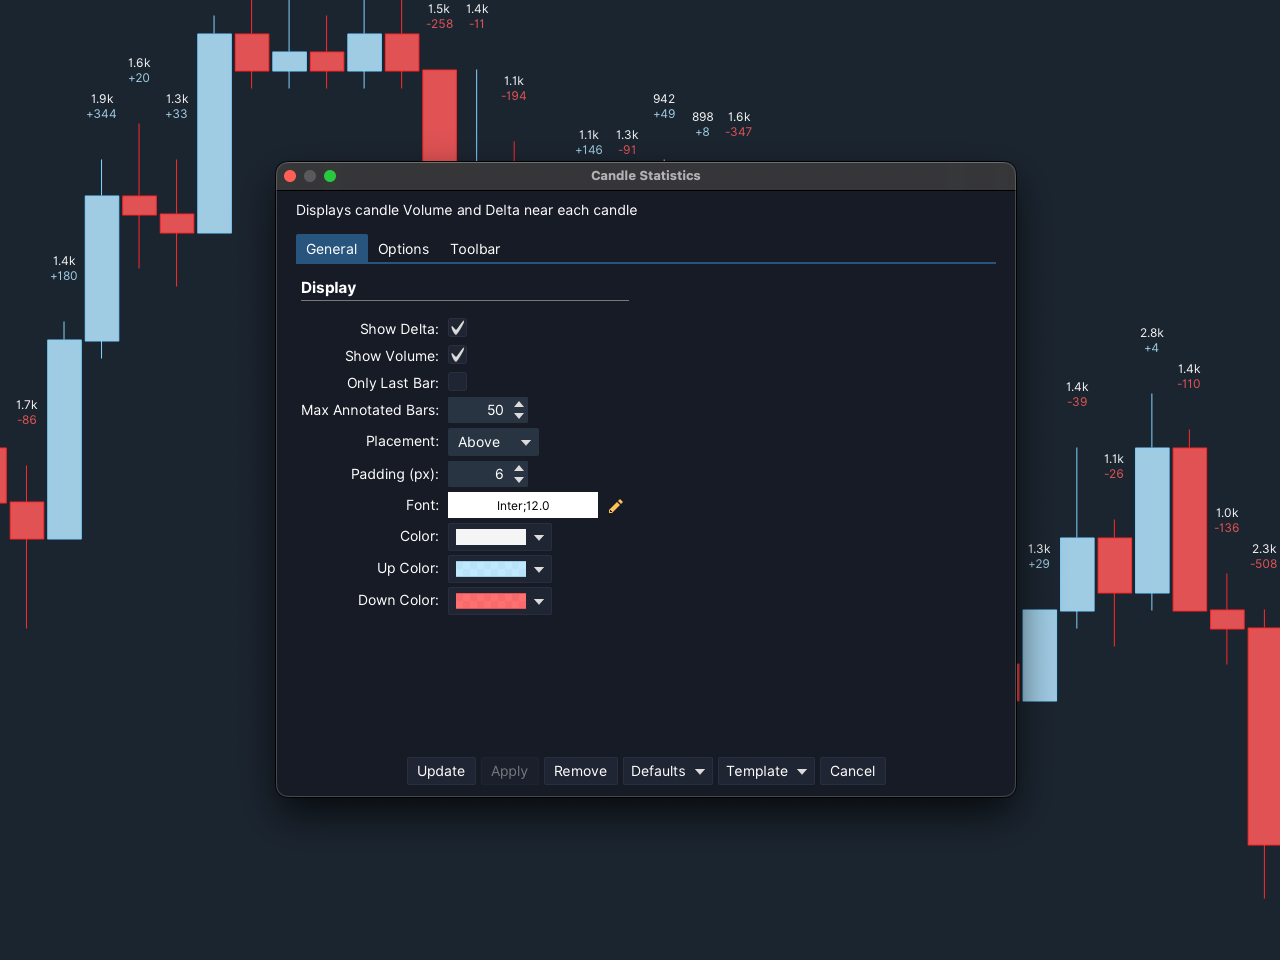
This overlay is useful for traders who want quick visual feedback on order flow without switching to a separate footprint chart. You can configure which metrics to show (delta, volume, or both), customize colors based on positive/negative delta, and limit the display to recent bars for cleaner charts.
Settings include placement options (above/below candles), font customization, and a bar limit to control how much history is rendered. The study requires tick data for accurate delta calculation.